Step 1: Introduction
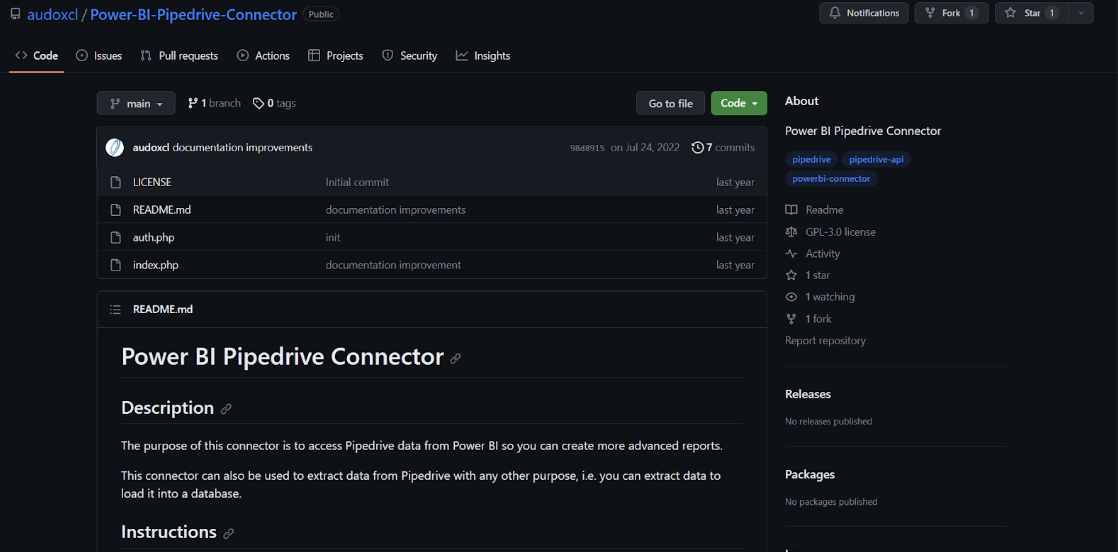
In this tutorial, we’ll guide you through the process of setting up a custom connector to extract data from Pipedrive and create a Power BI report. You can locate this custom connector on our GitHub page.
Step 2: Setting Up the Connector
Begin by visiting our GitHub page, where you will find the custom connector. In the video description, you will also discover a link to detailed instructions on how to set up this connector.
Step 3: Preparing the Power BI Report
Before we delve into setting up the connector, ensure that Power BI Desktop is installed on your system. If you don’t already have it, you can download and install it from the official website.
Step 4: Accessing the Power Query Editor
Open Power BI Desktop and create a new report. For this tutorial, we will use the report provided on our GitHub page.
To configure the custom connector, click on “Transform Data” to open the Power Query Editor.
In the Power Query Editor, you will find the necessary elements for configuring the connector.
Step 5: Connector Configuration
Within the Power Query Editor, configure the custom connector by providing the following information:
Connector URL: This is the URL where the connector is installed.
Connector Token: Note that you will require two tokens, one for the connector itself and another to access Pipedrive. You can name them according to your preference.
Domain: The domain that will be used later for generating hyperlinks within Power BI report.
Step 6: Building the Query
Let’s focus on how to construct the query for the “deals” table as an example. Right-click on the selected table and select “Advanced Editor.”
In the current view, you can see how to bring in data in JSON format from the connector’s URL.
Use the “Action Get Records” method from the source code to extract the “deals” object.
Pass the Pipedrive token as an argument.
After that, we set the starting record, and how many records at a time, the first time it starts from zero to a hundred, and then the connector automatically advances a hundred at a time until it finds no more records.
In the “Headers,” make sure to pass the connector token.
Step 7: Data Transformation
The following steps are needed to convert the JSON data into the fields needed for the report.
Step 8: Building Your Own Power BI Report
You can now return to Power BI Desktop from the Power Query Editor.
Create visuals, charts, and tables based on the data you’ve extracted from Pipedrive.
Customize the report as desired, including filters and user-specific information.
Step 9: Testing the Data
Now, let’s change the amount for an opportunity. In this case, select the deal for the organization “Smallville Resources,” using the icon that connects the URL for the deal in Pipedrive with the report.
In the Pipedrive deal, click on the Edit icon, then change the deal amount to $15K, and save the changes. Now, return to your report.
Refresh the data for the Power BI report.
Finally, you can see that the amount of the selected deal has changed to $15K.
Step 10: Conclusion
In conclusion, this tutorial has shown you how to connect Pipedrive and Power BI to create a data-driven report. By setting up this custom connector, you can extract data from your Pipedrive CRM and integrate it into your reports. This ensures that your reports remain up-to-date with real-time data, enabling your business decisions to be based on the latest information.
Step 11: Additional Resources
For further assistance and resources, we provide the following links:
Custom Connector on GitHub: You can find the custom connector used in this tutorial on our GitHub page. Access it here.
Sample Report: We’ve also made available a sample Power BI report for Power BI Desktop. You can download this report here.
Contact Us
If you’d like to get in touch with Audox, you can easily reach out through their official contact page here. Whether you have questions or inquiries, or you’re interested in our services Audox is committed to providing excellent support and is just a click away from addressing your needs.
